Friday, 29 April 2022

Cross-mating of Solar DC Connectors and Fire Safety


Imagine you've just got home with this season's must-have kitchen appliance - perhaps the Nostalgia Pop-up Hot Dog Toaster ("why boil water when you can  toast?")

You can almost taste those delicious toasted hot dogs as you unpack your new purchase but you notice a warning label attached to its power cable:  "Do not cross-mate this plug with sockets of another manufacturer's brand."  When you check the plug on your Pop-up Hot Dog Toaster and the power socket in your kitchen  you can see no identifying markings to tell you which company made either of them.  Disappointed, you reach for a pan to put some water on to boil...

This is the farcical situation in which the solar industry finds itself today.

An industry estimated to be worth $180bn in sales, producing 500 million panels a year cannot agree on a standard for the connectors that are used to wire up a solar installation.

What's more - many solar installers are going about their business blissfully unaware of regulations that mean it is not permitted to connect DC connectors from different manufacturers together.

About Solar Connectors
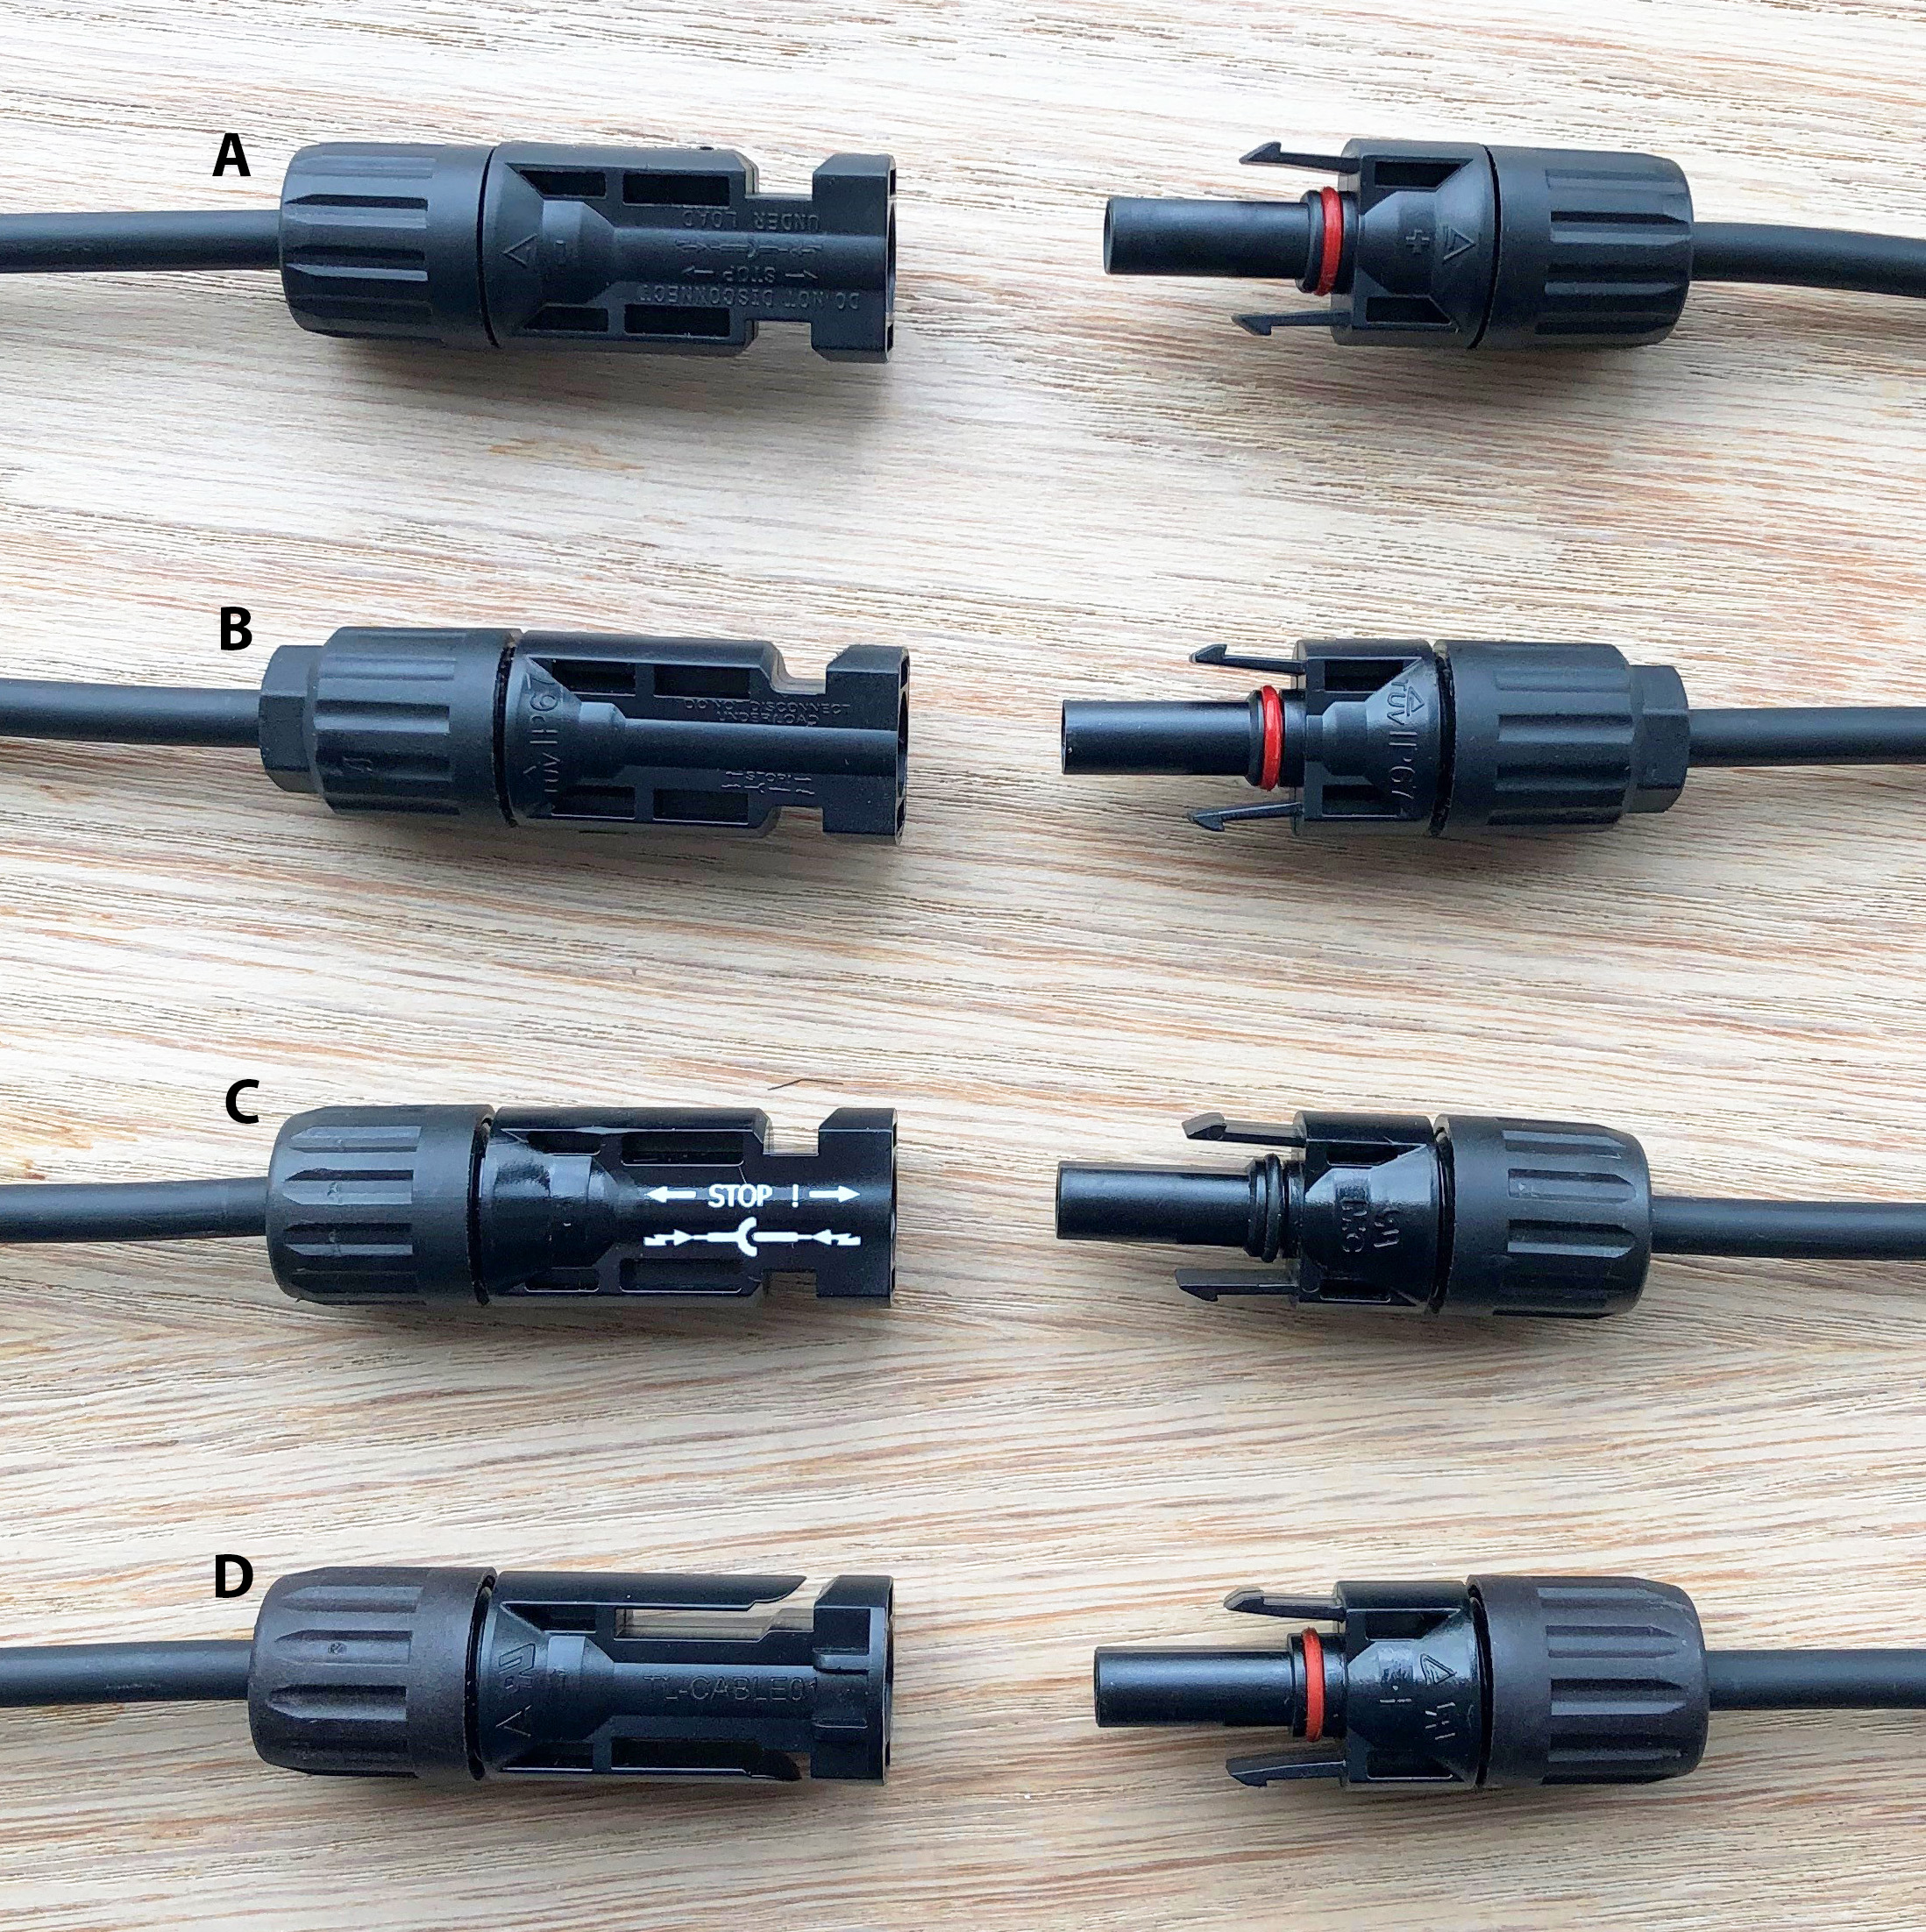

DC Solar Connector pairs from a selection of manufacturers
(A) Ningbo Yuling  (B) Shenzen Leader Technology   (C) Staubli International   (D) Tonglin


Solar panels come with a plug and socket attached to flying leads that enable one panel to be connected to the next to create the electrical circuit.  This connector is commonly referred to as an MC4, but in many cases it cannot strictly be called this (of which more later).  

MC4 style plugs and sockets are enclosed by plastic shells.  One of the shells has two plastic fingers that pop outward to lock the two together as they are pushed together by hand.  So long as the two connectors are pushed fully together, they cannot be accidentally disconnected if the cables are pulled.  

The "4" in the name corresponds to the 4mm diameter contact pin in the plug and the "MC" stands for Multi Contact, a US manufacturing company that invented this design of connector, now owned by Staubli International AG, a multinational manufacturer of electrical connectors, fluid connectors and robotics.

So only connectors made by Staubli can really be called MC4.  However since its invention, Staubli has watched on as low-cost manufacturers have brought out copies of the MC4, or at least copies that match closely enough that a plug from one manufacturer and socket from another can be physically pushed together.  These connectors are often referred to (not least by the companies that make them) as "MC4 Compatible", which of course makes it sound like it should be fine to use them interchangeably.   

And there are dozens of these other manufacturers making these MC-4 compatible connectors. Most solar PV panel manufacturers will have a number of different suppliers listed on their technical construction file so they can choose between them based on price and availability.  Some of the larger PV module manufacturers even have their own-brand in-house DC connectors just for their own panels.

MC-4 "Compatible"


Prohibited in some legal jurisdictions - but how would you ever spot it?


But who decides whether these connectors are truly "compatible" with one another?  

The design and dimensions of domestic plugs and sockets are clearly defined in technical standards (for example CEE-7 standards for plugs used in Europe and BS1363 -first published in 1947- in the UK).  Any plug or socket can be tested against the standard and declared to meet it by an independent test laboratory.  All plugs and sockets that meet the standard are safely inter-operable.  

By contrast, there is no such standard for DC solar connectors.  Connector manufacturers can go to a test laboratory such as TUV and get certification for their product, but for the most part the only testing undertaken is that their own plug and socket work together.  With so many different manufacturers, it is impractical to have to test every plug with every other manufacturers socket.  

Even when a manufacturer tests its connectors with those of another manufacturer - who is to say that the design will remain compatible since the other manufacturer could make changes to its design in the meantime and has no obligation to tell the first manufacturer.

Staubli has published in-house research on cross-mated connectors (see page 22 of this report) and (while recognising the researchers are commercially conflicted) the reported results do make the case that it is not safe to mix connectors from different manufacturers.  After subjecting the cross-mated connections to 2,000 temperature cycles and 1,000 hours of damp heat the connector resistance increased leading to connectors overheating, which in turn can result in a mechanical failure and a DC electric arc leading to a fire. 


Concerns about fire safety and the interoperability of DC connectors from different manufacturers has led many national solar installation standards bodies to either prohibit or advise against the mixing of plug and socket from different manufacturers.  


5.9 Where plugs and sockets are mated together in any part of the PV array circuit they shall be of the same model and from the same manufacturer.


In the UK, MIS3002 - the MCS installer standard for solar PV adopts the IET Code of Practice in full.  What this means, and it seems that many people in the solar industry are unware of it, is that for MCS compliant installations in the UK cross-mated connections are prohibited.

In the Netherlands, where there has been a high level of concern at fires starting in solar installations, there is a similar requirement.  NEN1010 is the applicable standard for low voltage electrical installations.  For solar DC wiring it has the following to say:

712.526.1   The combination of plugs and sockets from different manufacturers is only permitted if both manufacturers endorse the compatibility of the plug-socket.

NOTE 1 It is recommended that each plug and receptacle combination be made by the same manufacturer.

So while stopping short of the black and white position taken in the IET guide, the requirement that both manufacturers endorse the inter-compatibility of their products effectively does the same thing if such an undertaking is not available (which it commonly is not). 

Theory and Practice


The standards may be good in theory, but practical difficulties emerge as soon as you get on site and try to make a solar installation that complies with their requirements.  As mentioned before, solar panel manufacturers might make one batch with one manufacturer's connectors and then switch over for the next batch to another manufacturer that has given a better price.  If the panels an installer buys crosses over the batch then it will include panels with mixed connectors.

To make things more difficult for the installer, the connectors all look very similar and have few distinguishing features and marks.  

In addition to joining each solar panel to its neighbour in the row, the installer must make electrical connections across distances longer than the leads that come with the solar panel.  At the very least this would include cables connecting the first and last panels back to the electrical inverter but might also include cables to join spaced-apart arrays together.  These cables are commonly made to the right length on site by the installer, with cable and connector crimped together using hand tools (the additional fire risks posed by hand-crimped DC connectors is the subject of an upcoming blog).  


Connectors at either end of the string of solar panels are more likely to be cross mated as the long cable back to the inverter is made by hand on site.


To comply with the regulations while preparing these extension cables the installer must either: 

(a) identify the brand of connectors on the panels and purchase the same connectors locally - but they are not easy to identify and often not available to buy locally, or 

(b) snip off the connector from the panel cable and replace it with a locally bought one that matches the connector to be used on the extension cable.  In this case we are replacing a factory-made crimp with a  hand crimped joint and possibly invalidating the panel manufacturer's warranty by modifying the product.  

To help installers meet these challenging requirements, some panel manufacturers will not mix connector manufacturers and guarantee that their panels only come with genuine Staubli MC4 connectors which are readily sourced locally by installers.  

These manufacturers remain in the minority and most solar panel manufacturers are producing modules with a variety of different connectors, many of which cannot be sourced locally.  For these, solar installers find themselves between a rock and a hard place if they are to follow the regulations.


Conclusion


This is an international problem and the international standards bodies hold the key to solving it.  The International Electrotechnical Commission (IEC) Technical Committee 82 has apparently been discussing whether to create a specification for solar connectors for many years, but there is no sign of progress in this area.  

Solar installers and their customers find themselves caught between regulators creating installation standards that are almost impossible to meet in practice and an IEC committee packed with industry experts drawn from businesses that appear to have a commercial incentive to avoid the standardisation that would resolve the problem.

The Type 2 connector for Electric Vehicle (EV) charging was originally developed by a commercial company - Mennekes as a  proprietary standard.  It has been adopted as the standard for EV chargers and the specification is now described in IEC 62196, allowing manufacturers to make inter-operable products for the safety and convenience of customers.  This demonstrates that it is possible to put aside narrow self-interest for the good of the whole industry and more quickly advance the transition to clean energy.

It is shameful that the representatives of the solar industry at IEC have not managed to do the same.
Even if the IEC committee decided to act today, given the time standards take to develop, we would be many years away from seeing compatible connectors on the market.  

In the meantime many solar installers are unknowingly making non-compliant installations and could find themselves liable if the worst were to happen.  A good initial step that could be taken quickly would be for solar panel manufacturers to unilaterally declare on their solar panel rating plate which make and model of connector it is fitted with and, if the type is not widely available in the after-market, to supply matching connectors alongside the module.  This would enable installers to comply with standards.


Friday, 18 March 2022

How Safe is Solar PV?

 Putting the Numbers in Perspective


Comparing the fire risk from solar PV with that from common electrical appliances
Comparing the fire risk from solar PV with that from common household appliances


Recent research has advanced our understanding of the risk of solar PV fires.  The Building Research Establishment (BRE) and the Netherlands Organisation for Applied Scientific Research (TNO) published reports of their investigations of fire incidents involving solar PV installations in the UK and Netherlands respectively.

In this blog we take a look at the numbers and try to put them in perspective by comparing the findings from the reports with statistics for fires started by household appliances.


Fire and Solar PV Systems – Investigations and Evidence, Coonick et al, BRE National Solar Centre, 11th May 2018 (link)

Researchers from the BRE National Solar Centre investigated 80 fires in the UK that involved solar PV systems in some way, either because it was a potential source of the fire or because it was involved in a fire that started elsewhere. 

The solar PV system was found to be the source of the fire in 56 of the incidents.   Of these 22 were classified as serious fires (those that were difficult to extinguish and spread beyond the point of origination), with the remainder being classified as either localized or ‘thermal events’ (smoking, overheating).  The investigation looked at incidents that were both historical (33 that happened before the project start date of July 2015) and live (47 that occurred between July 2015 and February 2018).

It would be misleading to compare the number of fires caused by solar with the number of fires caused by other electrical appliances - because there are so many more of these.  To make the comparison fair we should take into account the number in operation.  I'll be using the number of fires each year per million systems in operation as the benchmark figure.

Taking the overall proportion of fires where the PV system was found to be the source of the fire (56 out of 80) and applying this figure to the 47 live incidents collected over the 30-month project length gives a rate of 13.2 solar PV fires/year.  

In January 2017 – half way through the study, the cumulative number of PV installations in the UK was 904,033 systems.

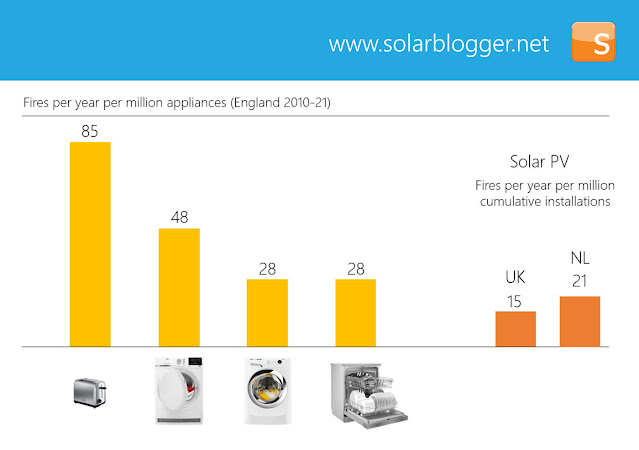
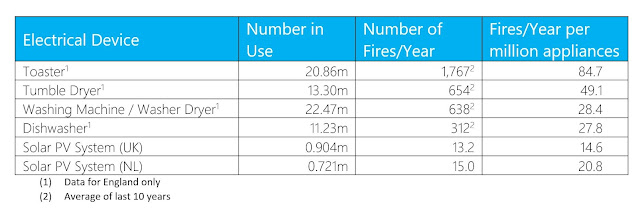
So our rate of 13.2 fires in 0.904m systems translates into 14.6 fires per million operational solar PV installations per year.


Brandincidenten met fotovoltaïsche (PV) systemen in Nederland. Een inventarisatie.  Bende EE & Dekker NJJ, TNO, 13th March 2019 (link)

The TNO researchers identified 28 incidents in the period 2015-2018 categorised into both residential properties and business (which includes both commercial buildings and ground arrays).  21 of the fire incidents occurred in 2018, and 15 of these were on residential properties.

The Central Bureau of Statistics (CBS) publishes data on the number of solar installations in the Netherlands.  At the end of 2018 there were 720,522 domestic installations, and 67,313 commercial installations.

The calculated fire rate for solar PV systems on domestic properties based on 2018 is therefore 15 in 720,522  or 20.8 fires per year per million systems in operation.


Comparison with Common Electrical Appliances

Data published by the UK Home Office on incidents attended by the Fire and Rescue Service in England breaks out the causes of fires, and from this we can get numbers that allow us to compare with the figures for solar PV.

Workings are detailed below, but what can be seen from the figures is that solar PV systems safety compares very favourably with that for electrical appliances that we wouldn't think twice about having in our homes.

It may be highly reassuring to say that a PV solar system is safer than a toaster or tumble dryer, but that doesn't mean that the solar industry should complacently sit back and do nothing.  Both reports highlighted common faults that can lead to fires.  In my next blog I'll be looking into these to ask what steps the industry can and should take to improve the safety of solar systems further.


Sources and workings on figures for electrical appliances 

In 2020 there were 27,292,000 UK households.  England represents 84% of UK population.  So let's assume 22,925,000 households in England.

98% of UK households own a washing machine, giving a number in use in England of 22.47m

91% own a toaster, giving 20.86m in use in England

58% own a tumble dryer, 13.30m in use

49% own a dishwasher, 11.23m in use


The Domestic appliance fires dataset was accessed from this UK government web page.  The average number of fires each year in England from 2010 to 2020 was used.  This figure is divided by the number of appliances in use (in millions) to get a rate per year per million appliances in use for comparison with the solar PV figures.

Friday, 11 March 2022

The Electric Arc and DC Solar Systems

If you cut a wire in an electrical circuit, current will stop flowing because the air in the gap is a very good electrical insulator so electrons cannot travel across it.


A electric field is formed between the positive and negative sides of the gap (which are called the electrodes), represented by the red field lines in the diagram below.


If you increase the voltage between the two electrodes, or narrow the distance between them, the electric field across the gap increases in strength.


If the electric field is strong enough, it will pluck electrons away atoms in the gas molecules in the field, causing the gas molecules to split into positive ions and negative electrons.  Both electrons and positive ions are attracted towards the oppositely charged electrode, so they accelerate off in that direction.  A current is now flowing in the circuit again.


But as the ions and electrons move in the field they can collide with gas molecules.  The energy from the collisions is seen as a temperature increase.


More electrons moving between the electrodes means there are more collisions with the uncharged gas molecules.  A chain reaction (or avalanche effect) occurs with more collisions leading to more charged particles and more charged particles leading in turn to more collisions.  We now have a high temperature plasma between the electrodes and this is a far better conductor of electrical current than air because of the greater number of charged particles available to move across the gap.


Temperatures are now so high in the gap that an intense white light is given off and the conductor material  may be vaporised away - an electric arc has formed.  

Even though the loss of electrode surfaces means the gap width increases the plasma's higher conductivity means that the current continues to flow.  A much lower voltage is needed to maintain an arc than is required to start it in the first place, an effect is well know in welding where 'striking an arc' refers to tapping the welding stick on the work piece and pulling it away.  The arc forms when the gap is narrow but is maintained as the stick is moved away to the working distance.

Arcs can be useful in applications such as welding, but undesired arcs are a potential source of fires with  the high temperatures in electric arcs easily capable of setting alight combustible material nearby.  Great attention is paid in electrical installations to avoiding arcs forming in the first place.

DC Solar Systems

There are two reasons why arcing is a particularly relevant consideration for solar systems.  

Firstly the voltages in solar systems can be very high compared to the Alternating Current (AC) supplied from the grid, and as we've seen the higher the voltage, the stronger the electrical field across a gap and the more likely is is that an arc will form.

In European countries AC electricity is supplied at 230-240V for domestic and small commercial buildings.  The most common electrical arrangement for the solar panels in a solar PV installation is to connect the panels (which might be 35V per 340Wp module) in a series string with the voltage increasing with each panel added.  For a 4kWp, 12 panel installation the voltage reaches 420V.  In larger commercial and utility scale installations voltages up to 1,000V or 1,500V are commonplace. 

Secondly, an AC electric arc is more likely to self-extinguish once formed because the voltage goes through zero volts 100-120 times a second (50 or 60Hz supply) and each time this happens the arc needs to re-establish.  Because the field strength required to start the arc is much higher than that needed to keep one going any increase in the arc length due to electrode erosion will mean that the arc will not re-establish.  By contrast the DC voltage in a solar PV wiring system is constant and the gap will need to open up much further before the arc is extinguished (this is why most forms of arc welding use DC current).

These factors mean that greater attention must be paid to arc risks in solar PV systems.  Despite this the safety of solar PV systems is very high, and this will be the topic of my next blog.


Tuesday, 22 February 2022

How Progressive Building Regulations Made Scotland a Solar Powerhouse


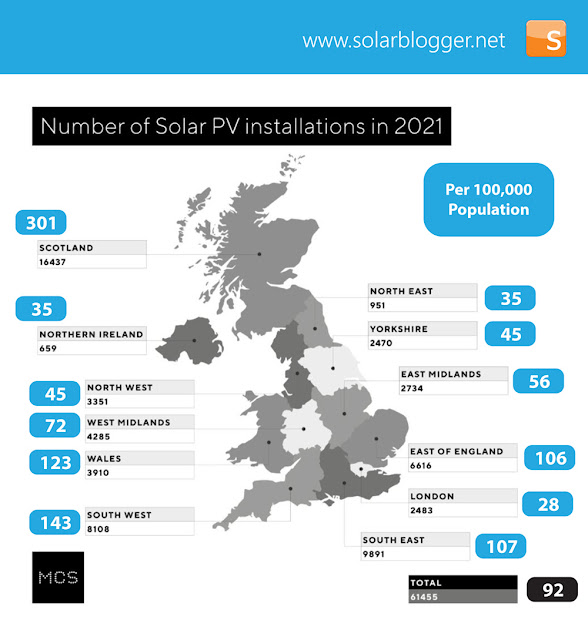
Statistics recently published by the Microgeneration Certification Scheme (MCS) show how much solar PV different regions in the UK installed in 2021.  Scotland really stood out from the pack, with more than 25% of all installations.  However, because the graphic only showed the number of installations, and didn't take into account the population of each region it doesn't really do justice to the wide differences between different parts of the UK.

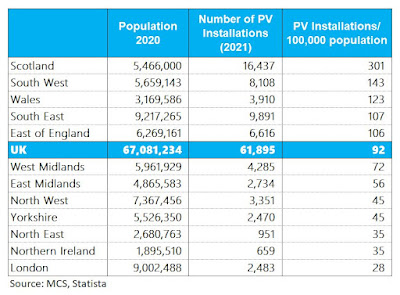
The Solarblogger has restated the figures above as the number of installations in 2021 per 100,000 of population in the region (the blue boxes).  

On this measure you can see that Scotland is installing two times more solar per head of population than the next nearest UK region (the South West) and more than three times the national average.

Compared to laggards like Northern Ireland and London, Scotland is installing more than ten times more solar PV installations per capita.  What is behind this incredible performance?


In 2015, Scotland brought in new building regulations that required housebuilders to construct homes that were significantly more energy efficient than those being built in the rest of the UK.  A year later George Osborne killed off the Zero Carbon Homes policy and developers in England have been building to performance levels largely unchanged from 2010 ever since.

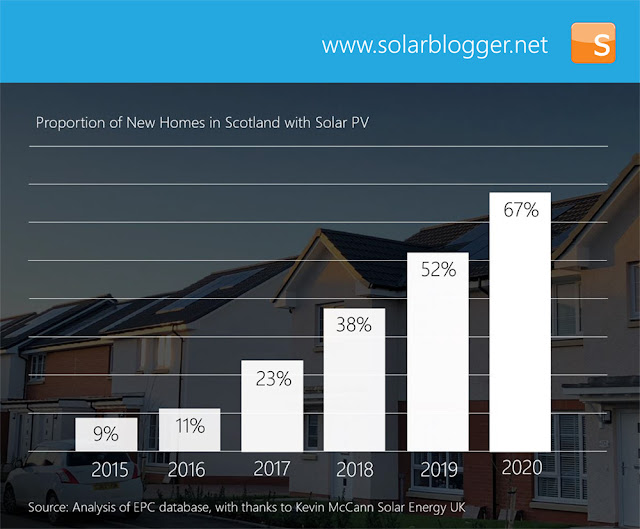
The preferred option of housebuilders in Scotland has been to meet the regulations with a combination of improved thermal insulation and airtightness, combined with a solar PV on the roof (or to be more accurate a solar PV installation in the roof).  As housing developments started under previous regulations came to an end and new projects started up that needed to meet the new regulations, the proportion of homes built with solar rose from around 10% before the regulations to nearly 70% in 2020.


According to an analysis of the EPC database in Scotland by Kevin McCann at Solar Energy UK, of the 15,447 EPCs registered for new homes in Scotland in 2020, 10,324 listed solar PV as an energy efficiency measure.

So of the 16,437 Scottish solar PV installations registered with MCS in 2021, it is likely that at least 10,324 were new homes, which would leave 6,113 that were retro-fitted to existing buildings. 

Taking this retrofit figure per head of population alone would give Scotland a score of 112 installations per 100,000 people - still impressive but it is clear that Scotland's stand out performance in solar PV installation has been driven by the building regulations for new homes.

In 2021 it is possible that there was an even higher figure for solar on new homes than that we have for 2020.   Lockdowns paralysed the construction industry for a good part of 2020, and 16,000 new homes is some way behind the long run average of around 20,000.  So the contribution to Scotland's performance from Building Regulations is likely to be higher still.

The good news is that regulations for England and Wales will soon exceed those in Scotland, with new regulations in England coming into force this June.  When that happens we should see solar PV installations per capita start to close the gap with those in Scotland.


Monday, 20 December 2021

The Social Housing Decarbonisation Fund – A Role for Solar PV

Padiham Near Burnley where 108 electrically heated homes were improved with external wall insulation, new windows and hot water systems, and Clearline fusion roof integrated solar PV by social landlord Places for People

On 19th October, the UK government revealed its much anticipated Heat in Buildings Strategy.  Headline writers entirely focused on only one element of the announcement -  the Boiler Upgrade Scheme, a plan to give grants of £5,000 to people replacing fossil fuel heating by installing a heat pump in their own home.  (See for example coverage from Sky News, Daily Telegraph, The Guardian, The Sun, BBC News).

However the Strategy contained other initiatives which, while less-publicised, better address the barriers to the transition to electric heating - by helping mitigate both their high running costs and expensive installation. These funds aimed at social landlords and Local Authorities takes a more holistic approach since they can also be used for measures that tackle running costs by reducing heating demand and generating power on-site.


The Social Housing Decarbonisation Fund


Less reported, but with a budget many times higher than the headline-grabbing Boiler Upgrade Scheme is the funding announced for the next three years for delivery through Local Authorities and Social Landlords.  The Social Housing Decarbonisation Fund (£800m over three years) is for energy improvements to social housing and the Home Upgrade Grant (£950m) will be administered by Local Authorities and support energy efficiency improvements for low income households.

For the Social Housing Decarbonisation Fund, the approach is summarised as follows:

  • Fabric first – heat loss prevention is prioritised before other energy efficiency measures
  • Worst first – homes with lower starting energy performance attract more funding
  • Upon completion homes must achieve a minimum Energy Performance Certificate (EPC) rating of C and maximum space heating demand of 90kWh/m2.year

It is set up as a competition, with applicants scored on how well they meet the goals above, as well as for deliverability and cost-effectiveness.  The landlord contributes at least 1/3 of the cost of the upgrade with 2/3 coming from the fund.  If a landlord takes the full grant and adds the minimum contribution only, then the amount that can be spent on each type of property is given below.  Landlords can elect to spend more on the property, but the extra is then provided by the landlord.


Starting EPC

Maximum Budget Supported

(with maximum grant and minimum landlord contribution)

D

£15,000

E

£18,000

F

£24,000

G

£24,000


These are pretty chunky amounts.

Eligible measures are anything that improves the EPC, with the exception of new fossil fuel heating systems.  Low carbon heating is encouraged, but only after fabric measures have been implemented.  The tenant must be left better off - with lower energy bills.

This is where solar PV comes in -  due to the high cost of electricity compared to gas, replacing gas heating with electric heating will increase energy bills, unless the starting levels of thermal insulation are exceptionally low and can be improved by a very large amount.  (See my earlier blog – Real-World Heat Pump Running Costs)

The complementarity of solar PV and heat pumps is well-understood by social landlords, as can be seen by reviewing the successful bids in the Social Housing Decarbonisation Fund Demonstrator, which were announced March 2021 and I have put into summary form in the table below.


Bid

Award

Number 
of homes

Measures

Aberdeen City Council

£2.2m

100

EWI, ASHP, PV

Argyll & Bute Council

£1.2m

130

EWI, ASHP, PV

Clackmannanshire Council

£0.3m

15

EWI, glazing, PV

Cornwall Council

£1m

75

EWI, ASHP, PV

Fenland District Council

£4.5m

160

EWI, glazing, PV

Leeds City Council

£4.2m

190

EWI, ASHP, PV

Barking and Dagenham

£9.6m

230

EWI, ASHP, PV

Manchester City Council

£3.1m

164

EWI, ASHP, glazing

Northampton Borough Council

£3m

150

EWI, ASHP, PV

Nottingham City Council

£2.3m

104

EWI, ASHP, PV

Nottinghamshire County Council

£0.8m

25

EWI, glazing, floor insulation

Kensington and Chelsea

£19.4m

535

EWI, ASHP, PV

Stratford-on-Avon DC

£1.4m

69

EWI, ASHP, PV

Stroud District Council

£1m

50

EWI, ASHP, PV

Sunderland City Council

£0.9m

59

EWI, glazing, PV

Warwick District Council

£1.4m

50

EWI, glazing, floor insulation

Wychavon District Council

£5.8m

236

EWI, ASHP, PV


Key: EWI – External Wall Insulation, ASHP – Air Source Heat Pump, PV – Solar photovoltaic panels


Fourteen out of seventeen successful bids, covering 2,103 out of 2,342 (90%) of the properties to be improved have solar PV among the measures to be installed.  In fact only one project (Manchester) is installing ASHP without PV.

With a total cost of £62.1m, the demonstrator projects grant component is an average of £26,000 per property – higher than the current ceiling, but due to solar PV being such a cost effective way to improve EPCs, it is likely to remain a feature of projects in the future waves.

This system approach to improving properties comprising significant improvements to insulation to lower heat demand, and combining low carbon heating with solar PV to keep a lid on the energy bills for residents seems far more sensible than a crude upfront grant to help cover some of the extra costs of the heat pump installation alone.

That winning combination of heat pumps and solar PV is well-understood by experienced practitioners of energy retrofit working in the social housing sector.  By contrast, owner-occupiers encouraged by generous grants to install heat pumps may find themselves on the phone to their local solar PV installer soon after their first electricity bills land on the doormat.

Thursday, 16 December 2021

Where Next for Solar PV Efficiency?

Source: NREL

In the early 1990s a research team led by Andrew Blakes and Martin Green at the University of New South Wales (UNSW) in Australia was working to reclaim the world record for the most efficient monocrystalline solar cell. The group had led the way throughout the 1980s, with a series of record-breaking developments that drove the efficiency of energy conversion in laboratory-made samples of solar PV cells from 18% in 1984 to 20% by 1986 but had lost the lead to a competing team from Stanford University in 1988.

In 1989 the UNSW group reported a new type of solar cell design- called a Passive Emitter Rear Collector (PERC) Cell, with an efficiency of 22-23%, reclaiming the world record for the team.

Throughout the 1990s improvements to the PERC cell technology made by the team increased the cell efficiency to 25%, a record that would stand for 15 years.

Fast forward to 2015 and PERC solar cells had made the transition from laboratory curiosity to deployment in mass-produced solar panels.  Over the next few years, PERC has come to dominate the solar market.  In 2019 all newly installed solar cell manufacturing lines were based on PERC technology, and PERC accounted for 65% of all solar cells manufactured.

What we can see from this history is that although the laboratory development work on PERC cells was completed by 1999, it took another 16 years before products based on the technology appeared in the market.  

We can also see from the chart that between 1999 and 2014 there was no further progress in advancing monocrystalline cell efficiency in laboratories around the world.  If recent record-breaking advancements take the same length of time to graduate from research devices to volume manufacture, we’ll be waiting until 2030 before they start to appear in commercial solar panels.

It may well be that due to the massive growth of the solar industry in the intervening time, current research budgets are far greater than those in 1999 so we might not have to wait for 16 years, but undeniably the introduction of PERC could represent a plateau in the relentless march of solar cell efficiency that has been a feature of the solar PV market for many years.


How Have Panel Manufacturers Responded?

With customers that have become used to panels that increased in power output each year, manufacturers have resorted to what might look like a cheap trick.  If the cells aren't getting any more efficient, let's make the panels bigger.  A proliferation of different cell formats and panel sizes has emerged.  See my earlier blog on panel and cell format proliferation.

This not-so-subtle sleight of hand has obscured the fact that technology has stalled.  Although panel powers are increasing, the specific power (power per square metre) is rising only slightly and due to more efficient packing of the cells into the larger panels.

However there is a limit to how big you can make a module before disadvantages in handling and ease of installation begin to offset and eventually exceed the benefits, especially in rooftop solar where mechanical handling is less easy to arrange.


Where Next for Solar Cell Efficiency?

The challenge for researchers seeking solar cell efficiency gains is that cells are already getting close to a brick wall - the Shockley Queisser limit.  This theoretical efficiency limit is based on physical laws.  For a single junction p-n semiconductor monocrystalline silicon cell like those in use is solar panels today the limit is 32%.  With lab cell efficiencies of 26.1%, the current record of is already 81% of the maximum it could ever be.

Some industry participants point to HeterojunctionTechnology (HJT) Cells at the successor to PERC.  Introduced by Sanyo in the 1980s and acquired by Panasonic in 2009, HJT solar cells currently have a world record efficiency of 26.7%, a little higher than PERC cells, but these cells have a similar theoretical efficiency limit based on a single p-n junction.

One way to break free of the theoretical efficiency limit is to create a cell containing multiple p-n junctions, each tuned to different wavelengths.  A broader range of wavelengths of light can then be converted to electricity. 

Among those exploring a multi-layer cell, one approach called a tandem perovskite cell looks closest to commercialisation.  (See for example Oxford Photovoltaics).  A thin film of photovoltaic perovskite material is laid down on the surface of the silicon cell.  The perovskite skims off energy from one set of wavelengths of light and allows the rest to pass through for conversion by the silicon cell below.  Efficiencies approaching 30% have been achieved in the laboratory and importantly the rate of improvement is rapid suggesting that there may be further improvements ahead.


Source: NREL

The problem facing any challenger technology is to overcome the inertia from huge investments in existing manufacturing plants for crystalline silicon cells and to prove to customers that the next new thing will have an equal lifetime.   What is interesting about the approach of the tandem perovskite cell is that it literally builds upon the well-proven crystalline silicon cell by adding a new layer.  Existing plant could be modified rather than scrapped, and the job of proving longevity is made slightly less challenging.

The rapid emergence of a global solar industry has been driven by a reducing cost of energy generated by solar, by pushing ever lower the cost per watt-peak of PV modules.  The twin engines of technological improvements to cell energy density and scale efficiencies have worked in concert to push this cost per watt-peak down year by year.  

Now it is looking like the cell technologies that have got the industry this far are approaching their limit.

Until today's breakthrough cell technologies make the journey from lab bench to mass production like the inventions of the UNSW team, the solar industry is going to have to rely more on economies of scale and manufacturing efficiencies to drive improvements.

Monday, 29 November 2021

Real-World Heat Pump Running Costs


Solar PV is a Necessary Enabler of the Transition to Electric Heating 

Much of the discussion of the transition to electric heating has focussed on the installation costs of heat pumps, but what do the running costs look like?  It’s all very well handing out £5,000 grants to make heat pump installations more affordable for consumers, but if people take this government incentive only to discover that the cost of energy bills become cripplingly expensive, the resulting negative coverage could stop the transition to clean heating before it gets going.  Conversely, if energy bills fall for houses with heat pumps, it will make it much easier to convince people to ditch their gas boilers.  To get a sense of costs, we need to know two things - how much does electricity cost compared to gas and what efficiency can we expect from heat pumps and gas boilers.

How Much do Heat Pumps Cost to Run?

Advocates of heat pumps regularly claim that a ‘well designed, well installed and properly run heat pump will cost no more to run than a gas boiler’.  A careful re-reading of this sentence will show you that three things have to go right for heat pumps to cost no more than gas heating. 

One thing we know for sure is that in the UK electricity costs much, much more per unit than mains gas.  Nottingham Energy Partnership has the average standard rate for electricity in September 2021 at 23.3p/kWh (kilowatt-hour), and mains gas at 4.39p/kWh.

The efficiency of a modern condensing gas boiler is often said to be around 90%, but since we are interested in real-world heat pump performance, we should compare like for like.  A field trial of the seasonal efficiency of 60 boilers by the Energy Saving Trust in 2009 gave a value of 82.5% for combi boilers.  

Using this efficiency one unit of gas heating costs 4.39/0.825 = 5.32p/kWh.

For heat pump heating bills to cost no more than a gas boiler, the efficiency of the heat pump would need to be higher than 100% x 23.3/5.32 = 438%, but what efficiency do heat pumps achieve in practice?

Real World Heat Pump Performance


The Energy Savings Trust and the Department of Energy and Climate Change (now called BEIS), set out to answer this question in 2008.  The first large-scale heat pump field trial in the UK aimed to determine how heat pumps perform in real-life conditions. The year-long field trial monitored technical performance and customer behaviour observed at 83 domestic properties across the UK.

The resulting report (Getting Warmer: a field trial of heat pumps), published in 2010, found that the average efficiency for an Air Source Heat Pump (ASHP) was 220% (page 16), although this was revised down to 182% by a subsequent analysis published in 2012.  This second report corrected errors and removed data provided  by ‘Manufacturer A’ which were felt to be from systems that had been hand-picked, carefully optimised and installed in the homes of the manufacturer's own staff.  (See Detailed analysis from the first phase of the Energy Saving Trust’s heat pump field trial, pages 19-25)

Note: I have focussed only on Air Source Heat Pumps because most people expect that this is the technology that will be deployed in the greatest number.  They are lower cost and more convenient to install than more efficient Ground Source Heat Pumps which require a deep bore hole to be drilled or trenches to be dug.

Image: System Efficiencies of Air Source Heat Pumps reported in “Detailed analysis from the first phase of the Energy Saving Trust’s heat pump field trial”


Despite the best efforts of the authors to put a gloss on things (“the best performing systems show that well-designed and installed heat pumps can operate well in the UK”), the results were highly disappointing.  


Real-World Heat Pump Performance - Try Again


The UK heat pump industry responded positively to the issues identified in the trial and significant changes were made to the regulatory scheme for UK heat pump installers. The Microgeneration Certification Scheme (MCS) rewrote its MIS3005 installation standard for heat pumps to better control the quality of system design, installation practices and householder training that had been shown to affect heat pump performance.

Consequently, a second phase of the study was initiated.  38 of the heat pumps in the first trial were selected for interventions to improve their performance. Interventions ranged from major (swapping an over or under-sized heat pump), medium (changing radiators, adding a buffer tank, replacing circulating pumps with variable speed DC pumps) or minor (changes to controls, refilling the ground loop, adding insulation). Householders also received improved guidance on how to operate the heat pumps properly.  Six new heat pump systems installed to the new MCS standard were added to the sample and all were monitored from April 2011 to March 2012.

The results for the second attempt were published in a summary and detailed form:


As a result of all these interventions, the average efficiency of ASHPs in the new study rose to 245% 

Note: this performance improvement Phase 2 and Phase 1 included a change of the definition of efficiency – on a like for like basis the increase was from 183% to 211%.  However the preferred efficiency measure in Phase 2 (SPF H4) is in my opinion a better comparator with boiler efficiency than the System Efficiency measure used in Phase 1.  System Efficiency includes losses between hot water tank and taps/showers, whereas the SPFH4 boundary stops at the hot water tank.   


Real World Heat Pump Performance - Third Time Lucky? 


Around 14,000 Heat Pumps were installed with funding from the RHPP, and 700 of these (around 5% of the total) were subject to a detailed monitoring study.  The study reports an average efficiency based on SPFH4 for the ASHP in the sample of 241%. 

However it also reveals that the heat meters used in the study were calibrated for water and not the antifreeze-mix with which most would be installed .  The estimated 4-7% over-statement of performance was not corrected in the published result.  Applying a mid-range 5% correction, would make the true average SPFH4 nearer 229%.

Reassuringly, this is still closer to the second EST study than the first and suggests that the changes made to the industry standards in response to the disappointing performance of systems in the first study had fed through into a higher general performance, across a reassuringly large sample of installations.

Taking efficiency from this most recent study of 229%, the annual energy costs for a house heated by a heat pump will be (23.3/5.32) x (100/229) = 1.91 times higher than the same house heated by a gas boiler.

So, even after industry steps to eliminate design errors, carefully optimising the installation and coaching the householder how to use the heat pumps, running costs are still double those of a gas heated property. 

What hope do we have when we scale up to install heat pumps in the huge numbers envisaged by UK policy makers?  If installations increase from 30,000 a year currently to the 300,000 a year called for by the government will the heat pumps perform as well as those in the second study, or is it more realistic to anticipate performance closer to the first study?

Adjusting the Price of Gas & Electricity


One approach to make heat pumps more appealing is to make gas more expensive and electricity cheaper.  Government indicated in its recently published Heat in Buildings Strategy that it would consider this approach:

we will look at options to shift or rebalance energy levies (such as the Renewables Obligation and Feed-in-Tariffs) and obligations (such as the Energy Company Obligation) away from electricity to gas over this decade” Heat in Buildings Strategy p16.

What impact might this have?  According to OFGEM  Environmental and Social Obligation Costs at 25% of the price of electricity, whereas it’s only 2.5% of the price of gas.


Infographic Bills, prices and profits, 27 Oct 2021, Source OFGEM

The cost of a unit of electricity might come down to 75% x 23.3p = 17.5p/kWh

By how much would gas need to increase to replace the lost revenue?  Again, according to OFGEM typical dual fuel domestic consumption values as of 1st April 2020 were: 12,000kWh for gas and 2,900kWh for electricity.  (Source - see footnote)

For an annual use of 2,900kWh for electricity, the social tariffs come to 25% x 2,900 x £0.233 = £169

For a gas use of 12,000kWh to replace this social levy, the price of gas would have to rise by £169/12,000 = 1.4p per kWh, taking the price of a unit of gas heating after boiler efficiency up to 6.72p/kWh

If this were to happen, we can adjust our calculation for the difference in running costs 

Under this scenario, an ASHP might have running costs (17.5/6.72) x (100/229) = 1.14 times higher than gas heating, but only in 10 years’ time as government makes clear that any transition would have to be gradual to avoid pushing people into fuel poverty.

Heat Pumps and Solar are a Perfect Combination

Even when heat pumps are ‘well installed and properly operated’, even by taking 25% off the cost of electricity and shifting it over to gas, it seems likely that consumers are going to be paying more for the shift to electric heating long after the bill for the installation cost has been settled.

For an average dual fuel bill with 12,000kWh of gas use at 4.39p/kWh, the heating cost is £527/year.  Taking the ASHP efficiency from the most recent study, with ASHP heating bills 1.91 times higher than gas, the extra cost to the householder is £479/year.

One way to make the transition to zero carbon heating cost neutral on running costs is to insulate the property and reduce its heat demand.  If heat demand could be halved, running costs would end up at the same level.  However, this might be a tall order for households that have already taken the basic steps of loft and cavity insulation and double glazing, and also taking into account that the hot water demand cannot be insulated away.

If a 3kWp solar system is installed with the heat pump, generating say 2,550 kWh a year of electricity, and if 50% of that generated electricity is used on site to offset electricity use at 23.3p/kWh (£297) and 50% is exported to the grid under the Smart Export Guarantee at 5p/kWh (£64) then we’ve saved the resident £361 a year from their energy bill.  If we combine this with battery energy storage and push the self-consumption of solar electricity up to 80%, then the corresponding saving becomes £500 a year.

The solar doesn’t need to be generating at the same time the heat pump is operating for the savings to be there – remember that any electricity use in the property can be offset (for example appliances, heating hot water and even charging electric vehicles), and every unit not bought from the grid is a saving on that household’s electricity bill.

Social Landlords, housebuilders and policy makers facing the challenge of how we are going to get our homes to zero carbon while bringing tenants, homebuyers and voters along for the ride need to start thinking of solar PV and other smart energy technologies as enabling technologies for zero carbon heating.  Otherwise the real-world running costs for heat pumps could prove to be an inconvenient barrier to mainstream adoption of electric heating.


Updates: 

2.12.21 - it was pointed out to me that the original version of this blog used gas boiler efficiencies of 90% (which are representative of laboratory test) and unfairly compared these with actual performance in the field for heat pumps.  The blog was updated to use field test results of combi-boilers from Final Report: In-situ monitoring of efficiencies of condensing boilers and use of secondary heating, 2009 The Energy Saving Trust, with annual efficiency of boilers re-set to 82.5% instead.