Showing posts with label energy bills. Show all posts

Friday, 20 May 2022

Owner Occupiers - Government's Final Frontier for Energy Efficient Buildings

Dutch Householders Must Now Include Renewables When Making Major Home Improvements
Image (C) Viridian Solar

UK energy efficiency laws have been made for new homes and new commercial buildings, for houses owned by private landlords (in England) and those managed by Social Housing  Providers (in Scotland), but the biggest part of the building stock has so far sailed on without interference from lawmakers in the UK - those owned by private individuals.

Unlike owner-occupiers; house-building companies, local authorities and social landlords don't get to cast a vote in a general election, making them easier targets for potentially costly or unpopular new laws.  When David Cameron's celebrated coalition government put forward an idea to require improvements to energy efficiency alongside home renovations called 'Consequential Improvements' in 2012 it survived only a few days after being  dubbed the 'Conservatory Tax' by the Daily Mail.  

See also this post from 2013 on the death of the Consequential Improvements idea.

If you are doing building works on your home, the current building regulations apply to the new bits you build, so any new walls and roofs would be insulated to modern levels.  The idea of the Consequential Improvements proposals was that (subject to the work exceeding a threshold of size) you should also have an obligation to make energy efficiency improvements to other parts of the building (for example topping up loft insulation or installing an efficient boiler or solar panels).

Looked at from the perspective of today, with occupants of inefficient housing most exposed to rampant energy cost inflation it certainly looks like a missed opportunity.  Hooray for the Daily Mail - a genuine force for good and yet again, as so often, on the right side of history!  Householders were freed from having to pay "hundreds of pounds extra on energy efficiency when they build an extension or fit a new boiler" in return for the privilege of paying thousands of pounds extra every year for soaring energy bills.


10 Years Later, in The Netherlands

Across the North Sea, the Netherlands government has brought in something that looks uncannily like the UK proposals of 10 years ago.

From February 1, 2022 an update to the "Bouwbesluit 2012" (Building Decree) regulations  place a requirement on renovation projects in Netherlands to include renewable energy.

Only renovation projects that meet both of the following requirements fall under the new rules:

 (a) more than 25% of the external envelope (ground floor, walls and roof) of the building is changed, and

(b) a heating or cooling system is part of the renovation - for example changing a central heating boiler, or replacing a third or more of the radiators.

The law applies to both housing and non-domestic properties. 

If a renovation falls under the new rules then renewable energy must be installed.  The amount you should install is derived from a formula which specifies the amount of renewable energy per year the system should yield:

30 x Aroof / Ag  kWh/m2.yr  (subject to a maximum of 30kWh/m2.yr)

Aroof is the roof area and Ag the "Gebruiksoppervlak" (usable floor area) as defined in NTA 8800:2020+A1:2020

So taking the example of a house with 100m2 of total usable floor area split in the typical Dutch style over ground floor and first floor in the roof , say 60 m2 to ground and 40 m2 to first floors together with a roof pitch of 45 degrees.  By trigonometry, the roof area is 1.41 x the ground floor area - 84.6 m2.  The calculated annual renewable energy is 30 x 84.6/100 = 25.4 kWh/m2.yr, or 2,540kWh/year in total when multiplied by the 100m2 total floor area.

This quantity of renewable energy production is very easily met with solar - around 3kWp would do it.

Certain exemptions are possible.  If you can show that the measures to meet the requirement would have a payback longer than 10 years, then you can install a smaller amount that does pay back in under this time.  Buildings with an occupancy type with very low energy use are exempt.  Finally buildings with special circumstances such as monumental buildings can be exempt from the requirement altogether if their protected status prevents the installation of measures.

The building owner has a choice of options to meet the requirement - for example joining a heat network, solar PV or installing a heat pump.  For solar PV, the Dutch government has helpfully provided a solar calculator to determine how much Solar PV is needed, based on NTA 8800:2020+A1:2020, a standard providing a method for the determination of energy use in buildings.   The solar calculation is from Chapter 16 of NTA 8800 and takes the installation details into account (orientation, shading, etc…).

In most cases the requirement for solar PV works out at between 15 and 20% of the roof surface area.  For example: Using  Clearline fusion PV16-335-G1 roof integrated solar panels (which are classed as ‘moderately ventilated’ because the air gap behind the panels exceeds 100mm); on a South facing orientation; on a 35⁰ pitched non-shaded roof; on a building of 100m2, you would need 8 panels to meet the requirement.

From the point of view of the solar industry, which offers a simple, proven and low-cost way to comply with the renewable requirement, this is a welcome change that ought to result in a good deal more solar PV on homes in the Netherlands.  

Looking at the requirements more critically through the lens of energy efficiency it does strike me a somewhat one-dimensional.  Why not require changes that improve fabric efficiency - thermal insulation and draft-proofing as well?  Perhaps the Netherlands building stock is more air tight and better insulated than that in the UK, but I'd be very surprised if there isn't lots of stock that could also benefit from improvements in this area.  The 'fabric first' brigade in NL must be looking for their pitchforks and burning torches.

The new renewables obligation in the Dutch Bouwbesluit 2012 does have the advantage of being very simple to calculate, implement and install.  Perhaps it's an example of pragmatic legislation that doesn't letting the perfect become the enemy of the good?  Just getting on and doing something to make a difference!  Is there a Dutch equivalent of the Daily Mail?  Where was it when it was needed to stamp all over a progressive and practical idea for improving the world?



Tuesday, 22 February 2022

How Progressive Building Regulations Made Scotland a Solar Powerhouse


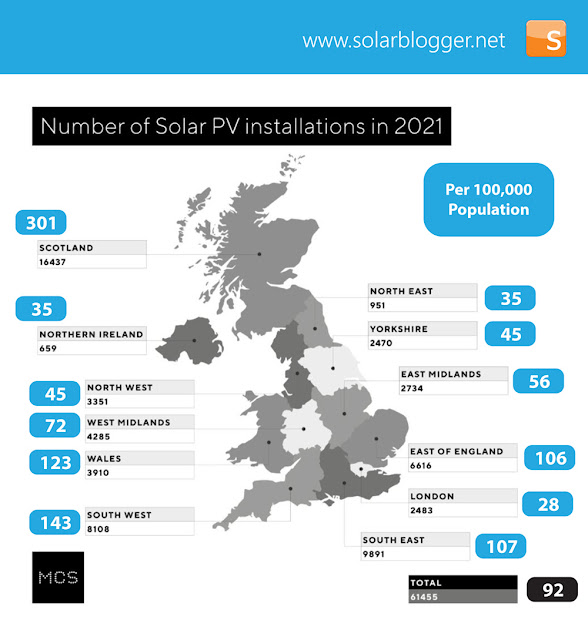
Statistics recently published by the Microgeneration Certification Scheme (MCS) show how much solar PV different regions in the UK installed in 2021.  Scotland really stood out from the pack, with more than 25% of all installations.  However, because the graphic only showed the number of installations, and didn't take into account the population of each region it doesn't really do justice to the wide differences between different parts of the UK.

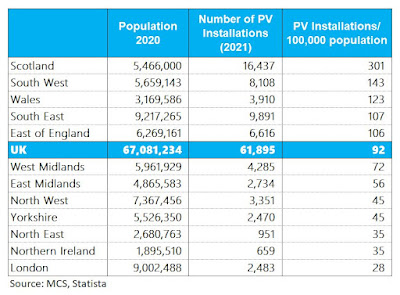
The Solarblogger has restated the figures above as the number of installations in 2021 per 100,000 of population in the region (the blue boxes).  

On this measure you can see that Scotland is installing two times more solar per head of population than the next nearest UK region (the South West) and more than three times the national average.

Compared to laggards like Northern Ireland and London, Scotland is installing more than ten times more solar PV installations per capita.  What is behind this incredible performance?


In 2015, Scotland brought in new building regulations that required housebuilders to construct homes that were significantly more energy efficient than those being built in the rest of the UK.  A year later George Osborne killed off the Zero Carbon Homes policy and developers in England have been building to performance levels largely unchanged from 2010 ever since.

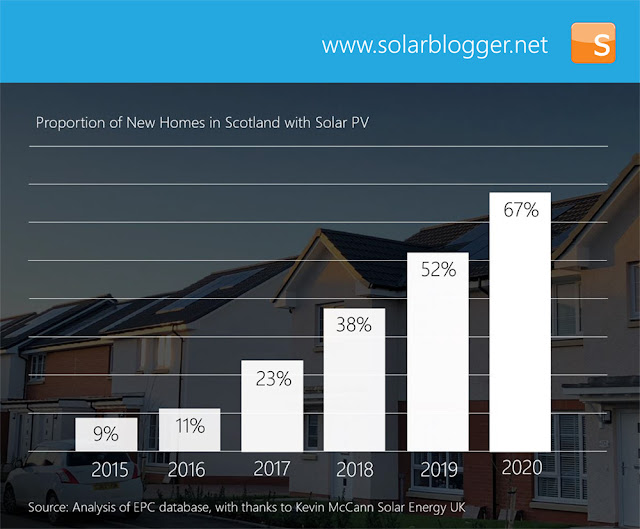
The preferred option of housebuilders in Scotland has been to meet the regulations with a combination of improved thermal insulation and airtightness, combined with a solar PV on the roof (or to be more accurate a solar PV installation in the roof).  As housing developments started under previous regulations came to an end and new projects started up that needed to meet the new regulations, the proportion of homes built with solar rose from around 10% before the regulations to nearly 70% in 2020.


According to an analysis of the EPC database in Scotland by Kevin McCann at Solar Energy UK, of the 15,447 EPCs registered for new homes in Scotland in 2020, 10,324 listed solar PV as an energy efficiency measure.

So of the 16,437 Scottish solar PV installations registered with MCS in 2021, it is likely that at least 10,324 were new homes, which would leave 6,113 that were retro-fitted to existing buildings. 

Taking this retrofit figure per head of population alone would give Scotland a score of 112 installations per 100,000 people - still impressive but it is clear that Scotland's stand out performance in solar PV installation has been driven by the building regulations for new homes.

In 2021 it is possible that there was an even higher figure for solar on new homes than that we have for 2020.   Lockdowns paralysed the construction industry for a good part of 2020, and 16,000 new homes is some way behind the long run average of around 20,000.  So the contribution to Scotland's performance from Building Regulations is likely to be higher still.

The good news is that regulations for England and Wales will soon exceed those in Scotland, with new regulations in England coming into force this June.  When that happens we should see solar PV installations per capita start to close the gap with those in Scotland.


Monday, 20 December 2021

The Social Housing Decarbonisation Fund – A Role for Solar PV

Padiham Near Burnley where 108 electrically heated homes were improved with external wall insulation, new windows and hot water systems, and Clearline fusion roof integrated solar PV by social landlord Places for People

On 19th October, the UK government revealed its much anticipated Heat in Buildings Strategy.  Headline writers entirely focused on only one element of the announcement -  the Boiler Upgrade Scheme, a plan to give grants of £5,000 to people replacing fossil fuel heating by installing a heat pump in their own home.  (See for example coverage from Sky News, Daily Telegraph, The Guardian, The Sun, BBC News).

However the Strategy contained other initiatives which, while less-publicised, better address the barriers to the transition to electric heating - by helping mitigate both their high running costs and expensive installation. These funds aimed at social landlords and Local Authorities takes a more holistic approach since they can also be used for measures that tackle running costs by reducing heating demand and generating power on-site.


The Social Housing Decarbonisation Fund


Less reported, but with a budget many times higher than the headline-grabbing Boiler Upgrade Scheme is the funding announced for the next three years for delivery through Local Authorities and Social Landlords.  The Social Housing Decarbonisation Fund (£800m over three years) is for energy improvements to social housing and the Home Upgrade Grant (£950m) will be administered by Local Authorities and support energy efficiency improvements for low income households.

For the Social Housing Decarbonisation Fund, the approach is summarised as follows:

  • Fabric first – heat loss prevention is prioritised before other energy efficiency measures
  • Worst first – homes with lower starting energy performance attract more funding
  • Upon completion homes must achieve a minimum Energy Performance Certificate (EPC) rating of C and maximum space heating demand of 90kWh/m2.year

It is set up as a competition, with applicants scored on how well they meet the goals above, as well as for deliverability and cost-effectiveness.  The landlord contributes at least 1/3 of the cost of the upgrade with 2/3 coming from the fund.  If a landlord takes the full grant and adds the minimum contribution only, then the amount that can be spent on each type of property is given below.  Landlords can elect to spend more on the property, but the extra is then provided by the landlord.


Starting EPC

Maximum Budget Supported

(with maximum grant and minimum landlord contribution)

D

£15,000

E

£18,000

F

£24,000

G

£24,000


These are pretty chunky amounts.

Eligible measures are anything that improves the EPC, with the exception of new fossil fuel heating systems.  Low carbon heating is encouraged, but only after fabric measures have been implemented.  The tenant must be left better off - with lower energy bills.

This is where solar PV comes in -  due to the high cost of electricity compared to gas, replacing gas heating with electric heating will increase energy bills, unless the starting levels of thermal insulation are exceptionally low and can be improved by a very large amount.  (See my earlier blog – Real-World Heat Pump Running Costs)

The complementarity of solar PV and heat pumps is well-understood by social landlords, as can be seen by reviewing the successful bids in the Social Housing Decarbonisation Fund Demonstrator, which were announced March 2021 and I have put into summary form in the table below.


Bid

Award

Number 
of homes

Measures

Aberdeen City Council

£2.2m

100

EWI, ASHP, PV

Argyll & Bute Council

£1.2m

130

EWI, ASHP, PV

Clackmannanshire Council

£0.3m

15

EWI, glazing, PV

Cornwall Council

£1m

75

EWI, ASHP, PV

Fenland District Council

£4.5m

160

EWI, glazing, PV

Leeds City Council

£4.2m

190

EWI, ASHP, PV

Barking and Dagenham

£9.6m

230

EWI, ASHP, PV

Manchester City Council

£3.1m

164

EWI, ASHP, glazing

Northampton Borough Council

£3m

150

EWI, ASHP, PV

Nottingham City Council

£2.3m

104

EWI, ASHP, PV

Nottinghamshire County Council

£0.8m

25

EWI, glazing, floor insulation

Kensington and Chelsea

£19.4m

535

EWI, ASHP, PV

Stratford-on-Avon DC

£1.4m

69

EWI, ASHP, PV

Stroud District Council

£1m

50

EWI, ASHP, PV

Sunderland City Council

£0.9m

59

EWI, glazing, PV

Warwick District Council

£1.4m

50

EWI, glazing, floor insulation

Wychavon District Council

£5.8m

236

EWI, ASHP, PV


Key: EWI – External Wall Insulation, ASHP – Air Source Heat Pump, PV – Solar photovoltaic panels


Fourteen out of seventeen successful bids, covering 2,103 out of 2,342 (90%) of the properties to be improved have solar PV among the measures to be installed.  In fact only one project (Manchester) is installing ASHP without PV.

With a total cost of £62.1m, the demonstrator projects grant component is an average of £26,000 per property – higher than the current ceiling, but due to solar PV being such a cost effective way to improve EPCs, it is likely to remain a feature of projects in the future waves.

This system approach to improving properties comprising significant improvements to insulation to lower heat demand, and combining low carbon heating with solar PV to keep a lid on the energy bills for residents seems far more sensible than a crude upfront grant to help cover some of the extra costs of the heat pump installation alone.

That winning combination of heat pumps and solar PV is well-understood by experienced practitioners of energy retrofit working in the social housing sector.  By contrast, owner-occupiers encouraged by generous grants to install heat pumps may find themselves on the phone to their local solar PV installer soon after their first electricity bills land on the doormat.

Monday, 29 November 2021

Real-World Heat Pump Running Costs


Solar PV is a Necessary Enabler of the Transition to Electric Heating 

Much of the discussion of the transition to electric heating has focussed on the installation costs of heat pumps, but what do the running costs look like?  It’s all very well handing out £5,000 grants to make heat pump installations more affordable for consumers, but if people take this government incentive only to discover that the cost of energy bills become cripplingly expensive, the resulting negative coverage could stop the transition to clean heating before it gets going.  Conversely, if energy bills fall for houses with heat pumps, it will make it much easier to convince people to ditch their gas boilers.  To get a sense of costs, we need to know two things - how much does electricity cost compared to gas and what efficiency can we expect from heat pumps and gas boilers.

How Much do Heat Pumps Cost to Run?

Advocates of heat pumps regularly claim that a ‘well designed, well installed and properly run heat pump will cost no more to run than a gas boiler’.  A careful re-reading of this sentence will show you that three things have to go right for heat pumps to cost no more than gas heating. 

One thing we know for sure is that in the UK electricity costs much, much more per unit than mains gas.  Nottingham Energy Partnership has the average standard rate for electricity in September 2021 at 23.3p/kWh (kilowatt-hour), and mains gas at 4.39p/kWh.

The efficiency of a modern condensing gas boiler is often said to be around 90%, but since we are interested in real-world heat pump performance, we should compare like for like.  A field trial of the seasonal efficiency of 60 boilers by the Energy Saving Trust in 2009 gave a value of 82.5% for combi boilers.  

Using this efficiency one unit of gas heating costs 4.39/0.825 = 5.32p/kWh.

For heat pump heating bills to cost no more than a gas boiler, the efficiency of the heat pump would need to be higher than 100% x 23.3/5.32 = 438%, but what efficiency do heat pumps achieve in practice?

Real World Heat Pump Performance


The Energy Savings Trust and the Department of Energy and Climate Change (now called BEIS), set out to answer this question in 2008.  The first large-scale heat pump field trial in the UK aimed to determine how heat pumps perform in real-life conditions. The year-long field trial monitored technical performance and customer behaviour observed at 83 domestic properties across the UK.

The resulting report (Getting Warmer: a field trial of heat pumps), published in 2010, found that the average efficiency for an Air Source Heat Pump (ASHP) was 220% (page 16), although this was revised down to 182% by a subsequent analysis published in 2012.  This second report corrected errors and removed data provided  by ‘Manufacturer A’ which were felt to be from systems that had been hand-picked, carefully optimised and installed in the homes of the manufacturer's own staff.  (See Detailed analysis from the first phase of the Energy Saving Trust’s heat pump field trial, pages 19-25)

Note: I have focussed only on Air Source Heat Pumps because most people expect that this is the technology that will be deployed in the greatest number.  They are lower cost and more convenient to install than more efficient Ground Source Heat Pumps which require a deep bore hole to be drilled or trenches to be dug.

Image: System Efficiencies of Air Source Heat Pumps reported in “Detailed analysis from the first phase of the Energy Saving Trust’s heat pump field trial”


Despite the best efforts of the authors to put a gloss on things (“the best performing systems show that well-designed and installed heat pumps can operate well in the UK”), the results were highly disappointing.  


Real-World Heat Pump Performance - Try Again


The UK heat pump industry responded positively to the issues identified in the trial and significant changes were made to the regulatory scheme for UK heat pump installers. The Microgeneration Certification Scheme (MCS) rewrote its MIS3005 installation standard for heat pumps to better control the quality of system design, installation practices and householder training that had been shown to affect heat pump performance.

Consequently, a second phase of the study was initiated.  38 of the heat pumps in the first trial were selected for interventions to improve their performance. Interventions ranged from major (swapping an over or under-sized heat pump), medium (changing radiators, adding a buffer tank, replacing circulating pumps with variable speed DC pumps) or minor (changes to controls, refilling the ground loop, adding insulation). Householders also received improved guidance on how to operate the heat pumps properly.  Six new heat pump systems installed to the new MCS standard were added to the sample and all were monitored from April 2011 to March 2012.

The results for the second attempt were published in a summary and detailed form:


As a result of all these interventions, the average efficiency of ASHPs in the new study rose to 245% 

Note: this performance improvement Phase 2 and Phase 1 included a change of the definition of efficiency – on a like for like basis the increase was from 183% to 211%.  However the preferred efficiency measure in Phase 2 (SPF H4) is in my opinion a better comparator with boiler efficiency than the System Efficiency measure used in Phase 1.  System Efficiency includes losses between hot water tank and taps/showers, whereas the SPFH4 boundary stops at the hot water tank.   


Real World Heat Pump Performance - Third Time Lucky? 


Around 14,000 Heat Pumps were installed with funding from the RHPP, and 700 of these (around 5% of the total) were subject to a detailed monitoring study.  The study reports an average efficiency based on SPFH4 for the ASHP in the sample of 241%. 

However it also reveals that the heat meters used in the study were calibrated for water and not the antifreeze-mix with which most would be installed .  The estimated 4-7% over-statement of performance was not corrected in the published result.  Applying a mid-range 5% correction, would make the true average SPFH4 nearer 229%.

Reassuringly, this is still closer to the second EST study than the first and suggests that the changes made to the industry standards in response to the disappointing performance of systems in the first study had fed through into a higher general performance, across a reassuringly large sample of installations.

Taking efficiency from this most recent study of 229%, the annual energy costs for a house heated by a heat pump will be (23.3/5.32) x (100/229) = 1.91 times higher than the same house heated by a gas boiler.

So, even after industry steps to eliminate design errors, carefully optimising the installation and coaching the householder how to use the heat pumps, running costs are still double those of a gas heated property. 

What hope do we have when we scale up to install heat pumps in the huge numbers envisaged by UK policy makers?  If installations increase from 30,000 a year currently to the 300,000 a year called for by the government will the heat pumps perform as well as those in the second study, or is it more realistic to anticipate performance closer to the first study?

Adjusting the Price of Gas & Electricity


One approach to make heat pumps more appealing is to make gas more expensive and electricity cheaper.  Government indicated in its recently published Heat in Buildings Strategy that it would consider this approach:

we will look at options to shift or rebalance energy levies (such as the Renewables Obligation and Feed-in-Tariffs) and obligations (such as the Energy Company Obligation) away from electricity to gas over this decade” Heat in Buildings Strategy p16.

What impact might this have?  According to OFGEM  Environmental and Social Obligation Costs at 25% of the price of electricity, whereas it’s only 2.5% of the price of gas.


Infographic Bills, prices and profits, 27 Oct 2021, Source OFGEM

The cost of a unit of electricity might come down to 75% x 23.3p = 17.5p/kWh

By how much would gas need to increase to replace the lost revenue?  Again, according to OFGEM typical dual fuel domestic consumption values as of 1st April 2020 were: 12,000kWh for gas and 2,900kWh for electricity.  (Source - see footnote)

For an annual use of 2,900kWh for electricity, the social tariffs come to 25% x 2,900 x £0.233 = £169

For a gas use of 12,000kWh to replace this social levy, the price of gas would have to rise by £169/12,000 = 1.4p per kWh, taking the price of a unit of gas heating after boiler efficiency up to 6.72p/kWh

If this were to happen, we can adjust our calculation for the difference in running costs 

Under this scenario, an ASHP might have running costs (17.5/6.72) x (100/229) = 1.14 times higher than gas heating, but only in 10 years’ time as government makes clear that any transition would have to be gradual to avoid pushing people into fuel poverty.

Heat Pumps and Solar are a Perfect Combination

Even when heat pumps are ‘well installed and properly operated’, even by taking 25% off the cost of electricity and shifting it over to gas, it seems likely that consumers are going to be paying more for the shift to electric heating long after the bill for the installation cost has been settled.

For an average dual fuel bill with 12,000kWh of gas use at 4.39p/kWh, the heating cost is £527/year.  Taking the ASHP efficiency from the most recent study, with ASHP heating bills 1.91 times higher than gas, the extra cost to the householder is £479/year.

One way to make the transition to zero carbon heating cost neutral on running costs is to insulate the property and reduce its heat demand.  If heat demand could be halved, running costs would end up at the same level.  However, this might be a tall order for households that have already taken the basic steps of loft and cavity insulation and double glazing, and also taking into account that the hot water demand cannot be insulated away.

If a 3kWp solar system is installed with the heat pump, generating say 2,550 kWh a year of electricity, and if 50% of that generated electricity is used on site to offset electricity use at 23.3p/kWh (£297) and 50% is exported to the grid under the Smart Export Guarantee at 5p/kWh (£64) then we’ve saved the resident £361 a year from their energy bill.  If we combine this with battery energy storage and push the self-consumption of solar electricity up to 80%, then the corresponding saving becomes £500 a year.

The solar doesn’t need to be generating at the same time the heat pump is operating for the savings to be there – remember that any electricity use in the property can be offset (for example appliances, heating hot water and even charging electric vehicles), and every unit not bought from the grid is a saving on that household’s electricity bill.

Social Landlords, housebuilders and policy makers facing the challenge of how we are going to get our homes to zero carbon while bringing tenants, homebuyers and voters along for the ride need to start thinking of solar PV and other smart energy technologies as enabling technologies for zero carbon heating.  Otherwise the real-world running costs for heat pumps could prove to be an inconvenient barrier to mainstream adoption of electric heating.


Updates: 

2.12.21 - it was pointed out to me that the original version of this blog used gas boiler efficiencies of 90% (which are representative of laboratory test) and unfairly compared these with actual performance in the field for heat pumps.  The blog was updated to use field test results of combi-boilers from Final Report: In-situ monitoring of efficiencies of condensing boilers and use of secondary heating, 2009 The Energy Saving Trust, with annual efficiency of boilers re-set to 82.5% instead.


Wednesday, 30 October 2019

What Is Primary Energy?


Primary Energy


Primary energy is a form of energy that is found in nature which has not been subjected to any artificial (human) conversion process. It is the energy contained in materials such as oil, natural gas, and coal which can be released by burning them.

The process of converting primary energy into other, more useful, forms of energy, involves energy overheads and efficiency losses and these mean that more primary energy is needed than is delivered as useful energy (heating for a building or electricity).  By way of example, let's follow the path of natural gas extracted from a giant gas field in Qatar and destined for the UK to make electricity in a power station (illustrated above):

Once extracted from the underground reserves, the gas is pumped through a pipeline to a processing facility.  Here it is cooled to -162C, the temperature at which it becomes liquid and loaded aboard a specialised Liquefied Natural Gas (LNG) tanker which transports it to the UK.  The gas needs to be kept cold during transport and this is done by insulating the containers it is carried in and allowing some of the gas to vaporise off.  Some (but not all) ships capture the gas and use it in turbines that drive the ship along.


At the UK port,  the liquefied gas is transferred into storage and kept at a cold temperature to remain liquid.  When it is needed it is re-gasified and pumped into to the UK gas network.  Finally, it arrives at an electrical power station where the gas might be burnt in a modern Combined Cycle Gas Turbine (CCGT).  This is the most efficient type of power -  because in addition to the heat from the combustion being used to raise steam and drive a turbine, the exhaust gases drive a second turbine.   The turbines drive rotating shafts which produce electricity in a generator set.

There are losses at every stage in this journey from gas deposit to electrical energy.  From an energy point of view, losses include the primary energy content of electricity or other fuels used as well as any burning or losses of the natural gas itself along the way.

A proportion of the gas is lost to the atmosphere and some may be flared (burnt off) at the rig or as part of the process filling the LNG tanker pressure vessels and during transportation.  The pumps to move the gas through the distribution system use electricity.

Up to 10% of the natural gas is bunt to drive turbo-compressors that refrigerate the gas to liquefy it for sea transport.

As it crosses the ocean, the LNG carrier will lose 0.1 - 0.25% of its gas each day.  This is allowed to boil off to maintain the low temperatures  - that means up to 5% of the shipment is lost between Qatar and the UK in a typical 18 day transit.  In addition the carrier uses either oil or the transported gas itself to drive its engines.  Some carriers can recycle the boil-off with re-liquefaction plant on board, but this also comes at an energy cost.

Gas sourced from the North Sea will consume less energy in its transportation than gas from Qatar or the USA, but taking a weighted average of all UK gas supplies (based on figures in SAP10.1) - energy or losses equivalent to around 12% of the heat energy in the gas is used up simply getting it to a house or power station in the UK.

The best CCGT power stations have a conversion efficiency of  54% (HHV) meaning that to generate one unit of electrical energy, gas with an energy content of 1.85 units must be burnt.

Putting all of these losses together - extraction, processing, transportation and then conversion to electricity - mean that to put 1 unit of electrical energy into the grid, you need to start off with gas in the ground that contains something like 2.1 units of heat energy - so the electricity generated this way is said to have a primary energy factor of 2.1


Primary Energy Factor for Grid Electricity


Other forms of electricity generation will have differing primary energy factors, so the average primary energy factor for grid electricity is a weighted average.  This will include energy from solar panels, wind turbines, burning biomass and bio gas, nuclear power as well as gas and oil, each with their own primary energy factors.
 
Although solar panels convert electromagnetic (light) energy to electricity and wind turbines do the same with the kinetic energy of wind, because these resources are considered inexhaustible, the convention is that renewable energy of this type has a primary energy factor of 1.0

According to SAP 10.1, the weighted average primary energy factor for UK electricity in the period 2020-2025 is expected to be 1.51.

The primary energy factor for electricity also varies depending on the generation mix that is contributing to UK electricity supply at any given moment in time.  SAP 10.1 uses monthly values to take into account that renewable energy contributes different amounts of energy as the seasons change.


Wednesday, 18 April 2018

Housebuilding Rates Unaffected by Higher Energy Efficiency

So Where's the Cliff Edge?


When faced with  potential legislation that would require them to build homes that use less energy, emit less carbon dioxide and reduce energy bills for their customers, housing developers have often expressed concerns that this would increase their costs and reduce the number of homes that get built.  Westminster politicians, concerned themselves about the 'housing crisis', seem to have bought into this argument and there has been no meaningful tightening of the building regulations for energy efficiency in England and Wales since 2010.  In 2015, plans to have regulated that all new homes would be net zero carbon emissions were dropped and as yet there is no sign of any interest from government in making new homes more energy efficient.  Instead of being zero carbon, a new home in England built today still emits 71% of the carbon of a new home built in 2005.


By contrast in Scotland, ministers pushed on with improvements to energy efficiency in new homes and new regulations introduced in 2015 mean that carbon emissions from newly built homes in Scotland emit significantly less CO2 than similar homes in the rest of the UK (around three quarters).

So now it is possible to test this assertion that building more efficient homes would reduce the numbers by comparing what happened in Scotland after the rules changed to what happened in England.

The graph shows the number of homes built by private developers in Scotland as a percentage of the number of homes built in England by private developers for each quarter between 2010 and Q3 2017 (the latest quarter for which data for both regions is available).

The rate of housebuilding in Scotland remains within historical norms despite significantly tougher energy regulations
With a population of 5.4m compared to England's 55.2m, the ratio might be expected to have a long term average around 10%, and indeed this is the case.

What is also clear is that since Q3 2015 when the new regulations came into force, the rate of housebuilding in Scotland has remained within its long-term range.  Where is the cliff edge of which we were warned?  Why don't the higher costs in Scotland put off house builders from building?  The answer is called the residual valuation model for land pricing.  Given clear guidance on direction of travel of policy, builders will adjust the amount that they are willing to pay for land.  The houses still get built, the builders still make money.  All that happens is that the windfall to the landowner when land achieves planning permission gets a tiny bit smaller.

So those local authorities that are lining up to fill the gap left by Westminster inaction by using their local plans to require higher that building regulations performance should take heart from the evidence and press on with their plans.

This article is an update of an earlier blog.


Tuesday, 16 January 2018

A Brief History of UK Energy Efficiency Policy


The track record of UK initiatives to encourage us to make our homes more energy efficient has been patchy to say the least.

 
The schemes come and go, but the results are depressingly consistent.

ECO

A range of government schemes have required the larger energy providers to invest in energy efficiency measures such as loft and cavity wall insulation for homes. The current version is the Energy Company Obligation (ECO), but before that we had CESP and CERT and others. This bizarre concept - making a business responsible for implementing measures that reduce demand for its own products - seems like putting a fox in charge of security improvements to the chicken coop. It is perhaps unsurprising then that foot-dragging, missed targets and ineffective measures have been the result.

In 2014, many of the energy suppliers were fined for failing to meet their targets to install insulation. British Gas was fined £11million, a development which their PR department brazenly promoted as a charitable donation.  One is left wondering if the energy companies considered these fines a small price to pay rather than helping people spend less on energy.

Measures installed under this scheme crashed by more than 80% after 2012 when a panicking George Osborne announced huge cuts following a Labour proposal to cap the prices people pay for energy.


Green Deal

Greg Barker's Green Deal scheme to 'transform the energy efficiency market' was in trouble almost from the start. Having told us that he'd struggle to sleep if the number of home improvements it financed was less than 10,000 in the first year, the actual number came in at 626.

In what now looks like a rather desperate effort, Greg managed to convince the Treasury to throw in a few hundred millions to the Green Deal Home Improvement Fund (GDHIF), to give a further cash-back grant to householders who installed energy efficiency measures. Most of this stop-start funding was spent on boiler replacements (and how many of these would have happened anyway as they reached end of life is open to debate). The scheme was ignominiously withdrawn after writing only a few thousand energy efficiency loans.

The offer to consumers was complicated and unappealing. The interest rate was a hefty 7%, which compares unfavourably with mortgage finance. Only measures that met the so-called 'Golden Rule' could be fully financed - where the estimated savings on energy bills were greater or the same as the repayments collected through your energy bills. What this all added up to was - go through all the hassle of having all this work done in your house and your energy bills will be about the same as they were before.

The Green Deal Finance Company is now in private hands, but it is still unclear how the new owners will address the fundamental shortcomings of the scheme.


Feed in Tariff and Renewable Heat Incentive


These schemes pay for renewable energy - power and heat where homes and businesses install technologies such as solar PV panels, solar thermal panels, heat pumps and wood chip burning stoves in their homes or businesses. The intention was that these would provide long-lasting and stable support for renewables after a series of start-stop grant schemes that had preceded them.

The Feed in Tariff (FIT) is due to close in 2019 after a tumultuous few years in which government struggled to keep up with rapid reductions in the cost of solar PV panels. As a result of the payments being fixed while the costs fell sharply, the financial returns from the scheme rose rapidly. Returns of 15-20% were not uncommon, payback periods as short as four or five years reported. As more and more people joined the party the budget ballooned. Cue panic in Whitehall, an over-correction on the tariff rates and a return to the boom-bust market from which the scheme was supposed to mark a departure.

The Renewable Heat Incentive (RHI) for heat generating renewables came in after the first FIT crisis, and as a result was designed with many more controls to stop a runaway deployment if the tariffs were set too high (with the notable exception of Northern Ireland where the executive for some reason removed the controls and blew the budget - the whole Northern Ireland budget!). In consequence, the RHI suffers from a paucity of ambition and has only resulted in a few tens of thousands of households replacing their heating systems with a low carbon technology (33,500 new domestic installations of solar thermal, heat pump and biomass boiler from April 2014 to November 2017)


MEES 


The Minimum Energy Efficiency Standard (MEES) applies in England and Wales and requires private landlords of both domestic and non-domestic properties to ensure that their properties meet a minimum level of energy efficiency.  Buildings that do not cannot be re-let after April 2018 and cannot be let at all after April 2020.

Unfortunately, as I revealed in an earlier blog, a landlord can apply for an exemption if they cannot do the required improvements without upfront costs, which relied on the Green Deal being available.  But this has now gone, leaving a loop-hole in the legislation so large you could drive an un-insulated house with broken windows through it.  Similar legislation being consulted upon in Scotland only deals with domestic properties, but sensibly places a limit on the maximum cost for a landlord.  So far, there's no apparent interest in fixing this mess at Westminster.


EESSH

The Energy Efficiency Standard for Social Housing (EESSH) is legislation in Scotland that requires social housing providers to ensure that their housing stock is all above a minimum energy efficiency level by the end of December 2020, with an intention to gradually ramp up the required levels over time.

EESSH looks like its already producing some significant investments in Scottish social housing.  It really does look like the one to watch, at least of all the schemes listed.

Is There Another Way?


What all these schemes have in common is that they deal piecemeal with the challenge of making our buildings more energy efficient. They imagine that the 'journey' to having an energy efficient home fit for the future is taken one small step after another. First insulate your cavity walls and loft. Then change your boiler to an efficient new one. Have some solar panels on that roof. Now replace your whole radiator system take out your efficient new boiler and fit a heat pump.

Many also rely on government spending, a fickle foundation upon which to base investments in housing stocks or to build long-term business plans (as those of us in the solar industry will attest).

With the demise of the Green Deal, and no sign of anything to replace it, there's a huge hole in the government's policy to meet forthcoming carbon budgets. This is not something that has gone unnoticed by the government's own Committee on Climate Change (CCC), which in its 2017 report gave government policy for residential energy efficiency a red light for able to pay households and an amber light for low income households.

It is into this gaping hole left by the UK government inaction and disinterest springs Energiesprong.  This is a concept that originates in the Netherlands that could totally revolutionise the way we approach domestic energy efficiency and it is the subject of my next blog.


Friday, 24 November 2017

The Carbon Intensity of UK Grid Electricity


What it Means for Low Carbon Buildings


Take a look at this chart. It's nothing short of astonishing. Up to 2012 the amount of carbon dioxide emissions associated with the delivery of one unit (kilowatt hour, or kWh) of electricity in the UK was hovering around 500gCO2/kWh. Since then, the amount of carbon dioxide that is emitted for each unit of electricity has plummeted. In 2016 the average was 269gCO2/kWh, a fall of nearly half in only four years. This change has far-reaching implications for regulators, not least those involved in ensuring the low carbon transition of the UK building stock, both newly constructed buildings and the improvement of the existing stock.

So what's behind the fall?


The first factor is the retreat of coal-fired power stations. In 2012, the government's Digest of UK Energy Statistics (DUKES) has coal fired power stations producing 44% of our electricity nuclear plants were suffering from outages and gas prices had risen, so coal use was at a high. By 2016 the corresponding figure for coal was only 9%. In the same period, gas fired power stations rose from 24% to 42% of UK power generation. This matters for two reasons. First of all, because coal is made up of long-chain hydrocarbons, with a higher ratio of carbon atoms to hydrogen atoms it produces about 60% more carbon dioxide than natural gas for each unit of heat energy produced in burning. Second, gas is more often burnt in a Combined Cycle Gas Turbine (CCGT) power plants with conversion efficiencies of up to 60%, compared to 40% for conventional steam turbines.


The second factor is the increasing contribution from renewables in the electricity supply. Enormous amounts of wind energy, biofuel fired generation and solar energy have come online. In 2012 renewables and 'other' represented 11% of UK electricity supply. In 2016, this had risen to 27.8%.

As a result the average carbon intensity of electricity in 2016 at 269 gCO2/kWh was only just higher than that for gas (216 gCO2/kWh). When you add in an efficiency for a gas boiler at (say) 80%, the gap disappears.

This is huge.

For years electricity has been the bad boy in low carbon building design. People fretted as a series of reports from the Energy Savings Trust showed that heat pump installations in the UK were operating nowhere near their advertised efficiencies and were consequently underperforming gas boilers for carbon emissions. Simple resistive electrical heating by panel heaters or immersion heaters for hot water were to be avoided at all costs.

Four short years later and all this is is turned on its head.

And we're only just getting started with renewables. In September, Dong Energy announced that it would move forward with the world's largest offshore wind farm, Hornsea 2 off the Yorkshire coast, with development costs that had fallen by half compared to previous offshore farms. A couple of week later, and not to be outdone, the UK's first subsidy-free solar farm was announced. It's still a bit of an outlier combining solar with battery energy storage and using pre-existing grid connections from with an earlier development, but it's a clear sign of the direction of travel. The carbon intensity of grid electricity is heading only in one direction.

But there's another wrinkle to consider. The carbon intensity of the grid is not a static value. It varies constantly as the mix of generators fluctuate to meet different levels of electricity demand and in response to changes in wind and sunlight. On 11th June this year, it was windy and sunny at the same time. Records tumbled. The carbon intensity of grid electricity in the middle of the day on was below 80gCO2/kWh.


So now the moment when you choose to take power from the grid is a strong determinant of the actual instantaneous carbon emissions your electricity use is creating.

Some uses of electricity - for example for preparing domestic hot water, or to some extent space heating buildings could be relatively time independent.  If I'd known ahead of time that carbon emissions would be so low on 11th July, I'd have been able to set a timer for my immersion heater to heat water for me at midday and got my tank of hot water at fully one third of the carbon emissions of using gas heating.

And the technology to do this is just around the corner.  This awesome new grid carbon intensity forcasting service has been recently launched by the National Grid the Met Office and WWF, with an API that software developers could use to do just this kind of thing.


So where does this leave low carbon building?


The current building regulations in England and Wales were last reviewed in 2012 and set minimum carbon emissions rates that developers must design to. The carbon intensity of electricity in the approved calculation (the Standard Assessment Procedure or SAP) is currently 519gCO2/kWh, which was accurate at the time. Now it is woefully behind the curve.

Buildings are normally intended to be long-lasting. If we allow ourselves to imagine a future where digital technologies, the smart distribution of electricity, demand response, energy storage and renewables combine in a so-called 'Smart Grid' then a number of significant observations about low carbon building emerge:

  • Even based on the current carbon intensity, never mind the future direction of travel over the life of a building, it is utterly beyond me that any new build or significant refurbishment should include gas heating.

  • The current enthusiasm among UK policy makers and local authorities for district heating (for example this recent consultation by Scottish government) could also be a troubling dead end. District heating itself is neither intrinsically clean nor green - it all depends what heat source you put at the other end of the pipes you're going to dig up all the streets to install. Gas fired combined heat and power may be seen as low carbon at the moment, but how long will it look so appealing if electricity continues on its current path?

  • Building codes are currently focused on regulating carbon emissions. In a world of low carbon electricity you can meet a carbon target with a draughty garden shed full of electric fan heaters. It's time to move to energy targets (kWh/m2) to create buildings that sip energy and liberate power for the demands created by the electrification of transportation.

If I was building my own Grand Design right now, my future-proof forever home based on these observations here's what I'd go for:

  • High levels of insulation and air tightness to drive down space heating demand to a practical minimum

  • Eliminate the wet heating system - I'd go underfloor electric coupled to a high thermal mass floor to allow price and carbon responsive electricity purchase to heat the slab at times of excess renewable generation

  • Direct electric hot water cylinder - again allowing price-responsive purchase of electricity as well as diversion of excess generation from...

  • the inevitable....beautiful solar panels on the roof - as many as possible!

Could this be the future direction energy efficient buildings? What do you think?