
Putting the Numbers in Perspective
 |
| Comparing the fire risk from solar PV with that from common household appliances |
Recent research has advanced our understanding of the risk of solar PV fires. The Building Research Establishment (BRE) and the Netherlands Organisation for Applied Scientific Research (TNO) published reports of their investigations of fire incidents involving solar PV installations in the UK and Netherlands respectively.
In this blog we take a look at the numbers and try to put them in perspective by comparing the findings from the reports with statistics for fires started by household appliances.
Fire and Solar PV Systems – Investigations and Evidence, Coonick et al, BRE National Solar Centre, 11th May 2018 (link)
Researchers from the BRE National Solar Centre investigated 80 fires in the UK that involved solar PV systems in some way, either because it was a potential source of the fire or because it was involved in a fire that started elsewhere.
The solar PV system was found to be the source of the fire in 56 of the incidents. Of these 22 were classified as serious fires (those that were difficult to extinguish and spread beyond the point of origination), with the remainder being classified as either localized or ‘thermal events’ (smoking, overheating). The investigation looked at incidents that were both historical (33 that happened before the project start date of July 2015) and live (47 that occurred between July 2015 and February 2018).
It would be misleading to compare the number of fires caused by solar with the number of fires caused by other electrical appliances - because there are so many more of these. To make the comparison fair we should take into account the number in operation. I'll be using the number of fires each year per million systems in operation as the benchmark figure.
Taking the overall proportion of fires where the PV system was found to be the source of the fire (56 out of 80) and applying this figure to the 47 live incidents collected over the 30-month project length gives a rate of 13.2 solar PV fires/year.
In January 2017 – half way through the study, the cumulative number of PV installations in the UK was 904,033 systems.
So our rate of 13.2 fires in 0.904m systems translates into 14.6 fires per million operational solar PV installations per year.
Brandincidenten met fotovoltaïsche (PV) systemen in Nederland. Een inventarisatie. Bende EE & Dekker NJJ, TNO, 13th March 2019 (link)
The TNO researchers identified 28 incidents in the period 2015-2018 categorised into both residential properties and business (which includes both commercial buildings and ground arrays). 21 of the fire incidents occurred in 2018, and 15 of these were on residential properties.
The Central Bureau of Statistics (CBS) publishes data on the number of solar installations in the Netherlands. At the end of 2018 there were 720,522 domestic installations, and 67,313 commercial installations.
The calculated fire rate for solar PV systems on domestic properties based on 2018 is therefore 15 in 720,522 or 20.8 fires per year per million systems in operation.
Comparison with Common Electrical Appliances
Data published by the UK Home Office on incidents attended by the Fire and Rescue Service in England breaks out the causes of fires, and from this we can get numbers that allow us to compare with the figures for solar PV.
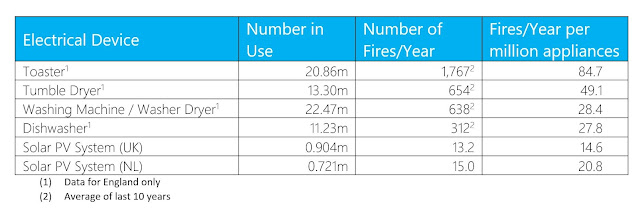
Workings are detailed below, but what can be seen from the figures is that solar PV systems safety compares very favourably with that for electrical appliances that we wouldn't think twice about having in our homes.
It may be highly reassuring to say that a PV solar system is safer than a toaster or tumble dryer, but that doesn't mean that the solar industry should complacently sit back and do nothing. Both reports highlighted common faults that can lead to fires. In my next blog I'll be looking into these to ask what steps the industry can and should take to improve the safety of solar systems further.
Sources and workings on figures for electrical appliances
In 2020 there were 27,292,000 UK households. England represents 84% of UK population. So let's assume 22,925,000 households in England.
98% of UK households own a washing machine, giving a number in use in England of 22.47m
91% own a toaster, giving 20.86m in use in England
58% own a tumble dryer, 13.30m in use
49% own a dishwasher, 11.23m in use